Pages

Monday, October 31, 2011

HTC shipped 13.2m handsets in Q3 2011

"HTC's financial performance improved greatly in the third quarter, thanks to massive growth in handset shipments.
During the period, HTC generated nearly NT$136 billion (US$4.5 billion) in revenue, jumping 79 percent over the same period last year. HTC's after-tax profit hit $624 million, representing a 68 percent gain year-over-year.
According to HTC, which announced its earnings today, it shipped 13.2 million handsets worldwide, up 93 percent year over year.
HTC's third-quarter success follows similarly impressive growth in handset shipments from its top competitors, Apple and Samsung.
Last week, Samsung announced that its smartphone shipments jumped more than 300 percent compared to the third quarter of 2010. That success helped Samsung nab 23.8 percent of the smartphone space during the period, according to research firm Strategy Analytics. Apple's iPhone captured 14.6 percent of the market."

Entertainment (e.g. Netflix) accounts for 60% of US web traffic at peak times

"Within fixed networks in the United States, Real-Time Entertainment applications are the primary drivers of network capacity requirements, accounting for 60% of peak downstream traffic, up from 50% in 2010. Rate-adaptive video represents the majority of video bandwidth, with Netflix alone representing 32.7% of peak downstream traffic, a relative increase of more than 10% since spring.
We have entered the “Post-PC Era”, as the majority of Real-Time Entertainment traffic (55%, by volume) is destined for game consoles, set-top boxes, smart TVs, and mobile devices being used in the home, with only 45% actually going to desktop and laptop computers over North American fixed networks.
Video in mobile networks continues to gain momentum.  In North America, Real-Time Entertainment is now 32.6% of peak downstream traffic, while in Asia Pacific it is 41.8%.  The largest contributor is YouTube, and other applications like peercasting PPStream and Netflix are making inroads.
Mobile Marketplace traffic accounts for 9.4% of peak downstream usage in APAC and 5.8% in North America, led in both cases by Apple and Google. Applications like Skype and WhatsApp Messenger, that replace the traditional revenue sources of voice and texting, are being installed by growing numbers of subscribers.
In North America on fixed networks, mean usage remained generally flat at the high end (22.7 GB from 23.0 GB reported in May) and median usage dropped to 5.8 GB from 7.0 GB. This shows that while subscribers aren’t using more traffic overall the usage gap between heavy and light users is broadening and that more data is being used during the small peak period window.  In Asia-Pacific fixed networks, median monthly usage is 17.7 GB, which is the largest we have observed."
Source:  Data from Sandvine, reported in a press release, 26th October 2011

Samsung is the world's largest smartphone manufacturer

"Samsung has overtaken Apple in worldwide smartphone shipments after Apple suffered its lowest levels of shipments in two years, according to research firm Strategy Analytics.
Global smartphone shipments grew 44% year-on-year to reach a record 117 million units in the third quarter of 2011, said the survey. Samsung shipped 28 million smartphones, grabbing 24% market share and overtaking Apple.
[...]
Apple's share of the tablet market has also shrunk by 29% to 67%, as Google's mobile operating system (OS) Android took a chunk out of the company's global sales during the last quarter this year.
Nokia's market share fell from 33% in the same period in 2010 to 14% in 2011. Strategy Analytics believes Nokia's new Lumia smartphone range, running Microsoft's Windows Phone 7.5 OS, could drive recovery for Nokia's marketshare.
Global handset shipments grew 14% in the third quarter of 2011 to reach 390 million units."
Source:  Computer Weekly, 31st October 2011

7 of the 10 most followed people on Twitter are women

"# Name (Screen Name) Followers
1. Lady Gaga (ladygaga) 15,117,972
2. Justin Bieber (justinbieber) 13,868,314
3. Katy Perry (katyperry) 11,511,972
4. Barack Obama (BarackObama) 10,872,247
5. Kim Kardashian (KimKardashian) 10,735,244
6. Britney Spears (britneyspears) 10,662,045
7. Shakira (shakira) 9,802,132
8. Rihanna (rihanna) 9,055,660
9. taylorswift13 (taylorswift13) 8,759,295
10. ashton kutcher (aplusk) 8,028,802"
Source:  Retrieved from Twitaholic, 31st October 2011

Sunday, October 30, 2011

Join this contest and win exciting prizes like iPhone4s, Laptop and iPod Shuffle


Hi Friends............!
Join this ParisTamil Website using mentioned link below and Win exciting prices by scoring of high points.

Prizes:
1st Prize iPhone 4s
2nd Prize Laptop
3rd to 10th Winners get the Prize of iPod Shuffle


To Join in this contest:
* Your name, country, language, telephone number, e-mail to register under must create an account on our site using mentioned link below.

Tamil Link : http://www.paristamil.com/contest/share-ref-776-fed-ta51.htm

French Link : http://www.paristamil.com/contest/share-ref-776-fed-fr51.htm

 
Way to gain points:
 * After successful registration, you will get a second mail with your refer link. Send the second mail to your friends and receive points for win.

* When they had a record 100 points through the link in the email. 50 points from their friends in the recording area 25 points, followed by friends, will continue through the attachment points for you to rise through the passing on 10 basis points.

* I will send you a download link through a record 25 extra points every 100 will develop
Winners will be selected on the basis of the points *.

 
Way to increase the points:

 After registration you will receive e-mail * Link to the Facebook, Twitter through such social sites to share with your friends and get points.
* You will see the received points through your account.


* Results for the first match will see 01 January 2012


* The starting date of second contest is specified on the paristamil website.


Tamil Link : http://www.paristamil.com/contest/share-ref-776-fed-ta51.htm

French Link : http://www.paristamil.com/contest/share-ref-776-fed-fr51.htm

To getting more points, you just refer your friends.


பரிஸ்தமிழ்.கொம்
நடாத்தும்
31 December 2011Laptop
2Gb Apple iPod shuffle Digital Player
மாபெரும் போட்டி
போட்டியில் இணைந்து கொள்ள கீழ் உள்ள இணைப்பை சொடுக்கவும்.
பரிசுகள்
1ம் பரிசு உங்கள் பெயர் பொறிக்கப்பட்ட Iphone 4S
2ம் பரிசு மடிக்கணனி Laptop
3 முதல் 10ம் இடம் வரை வென்றவர்களுக்கு 2Gb Apple iPod shuffle Digital Player
போட்டியில் இணைவதற்கு செய்ய வேண்டியது
* உங்கள் பெயர், நாடு, மொழி, தொலைபேசி இலக்கம், மின்னஞ்சல் என்பவற்றை பதிவு செய்து எமது தளத்தில் ஒரு கணக்கை உருவாக்க வேண்டும்.

புள்ளிகளைப் பெறும் வழி:
* பதிவை மேற்கொண்ட பின்னர் கிடைக்கும் இரண்டாவது மின்னஞ்சலை நண்பர்களுக்கு அனுப்பிவைப்பதன் மூலம் வெற்றிக்கான புள்ளிகளைப் பெறுவீர்கள்.
* அவர்கள் அந்த மின்னஞ்சலில் உள்ள இணைப்பின் ஊடாக பதிவை மேற்கொள்ளும் போது 100புள்ளிகளும்.
அவர்களின் நண்பர்கள் பதிவு செய்யும் இடத்து 50 புள்ளிகளும்
தொடரும் நண்பர்கள் ஊடாக 25புள்ளிகளும் அதனை தொடர்ந்து வரும் இணைப்பின் ஊடாக 10புள்ளிகள் என்ற அடிப்படையில் உங்களுக்கான புள்ளிகள் அதிகரித்துச் செல்லும்.
* உங்களால் அனுப்பி வைக்கும் இணைப்பின் ஊடாக பதிவை மேற்கொள்ளும் ஒவ்வொரு 100 பதிவிற்கும் 25 மேலதிக புள்ளிகள் கிடைக்கும்
* பெறும் புள்ளிகளின் அடிப்படையில் வெற்றியாளர்கள் தேர்வு செய்யப்படுவார்கள்.
மேலும் புள்ளிகளை அதிகரிக்கும் வழி:
* உங்கள் பதிவின் பின்னர் கிடைக்கும் மின்னஞ்சலில் இருக்கும் Linkஐ Facebook, Twetter போன்ற சமூகத் தளங்களின் ஊடாகவும் உங்கள் நண்பர்களுடன் பகிர்ந்து புள்ளிகளைப் பெற்றுக்கொள்ளலாம்.

* நீங்கள் பெறும் புள்ளிகளை உங்கள் கணக்கில் உள்நுளைவதன் ஊடாக பார்வையிடலாம்.
* முதல் போட்டி முடிவுகள் 01 ஜனவரி 2012 அறியத் தருவோம்
* இரண்டாவது போட்டி ஆரம்பிக்கும் திகதியை பரிஸ்தமிழ்.கொம் இல் அறியத் தருவோம்.

நன்றி
பரிஸ்தமிழ்.கொம்
நிர்வாகம்

Thursday, October 27, 2011

Differences between users of different mobile operating systems

"Android users are more likely than users of other platforms to visit education sites.
Windows Phone users are more likely to visit email and communications sites, compared to users of other platforms.
Feature phone users are far and away the most likely to visit social-network and community sites on their handsets, with Android users being the least likely.
BlackBerry (RIM) users are more likely than anyone else to visit computer and sports sites.
Android users are the most likely to view “Music, video and media” sites whereas iPhone users are least likely to view sites in that category.
Across all platforms, the top 2 categories (other than “Unclassified”) are: “Social networks & community” and “News & information”."
Source:  Taken from Opera's State of the Mobile Web report, 27th October 2011
Note - based on behaviour of people who use the Opera browser on their phone

49% of people exposed to Doritos ads on XBox LIVE subsequently went out and bought Doritos

"Doritos’ ‘Unlock Xbox’ competition invited fans to capture the essence of the snack in the form of a Doritos Xbox LIVE Arcade game with the opportunity to win a $50,000 gaming consultant project. The campaign put the votes of Xbox LIVE users at the heart of the contest, driving far-reaching engagement and ensuring huge interest in the final Doritos games. The field was narrowed to eight by an expert panel of judges, and then pared down to three by the votes of Xbox LIVE visitors. After a pitch at Microsoft headquarters, the two finalists (Doritos Crash Course and Harm’s Way – by Doritos) were launched for free download on Xbox LIVE, with gamers voting on their favourite.
Key results:
Throughout the contest, Unlock Xbox delivered exceptional engagement levels
The winning game became the fastest downloaded Xbox LIVE Arcade game in history with over 1 million downloads in the first two weeks
Over 50% of those exposed to the Doritos ads on Xbox LIVE clicked to learn more about the contest
40% voted for their favourite Doritos Xbox LIVE Arcade game
72% took action after seeing Doritos advertising on Xbox LIVE
24% told friends about the Doritos Xbox competition
49% went out and bought Doritos"

Digital platforms account for nearly 30% of all UK radio listening

"Listening to radio via a digital platform in terms of weekly reach* has increased by 12% year on year,
with 22.8 million people now tuning in to radio via a digitally enabled receiver (DAB, DTV, internet) each
week (up from 20.4 million in Q3, 2010).
Digital listening  hours for Q3, 2011  reached 304 million hours,  up 16%, from 262 million hours in Q3,
2010.   DAB radio maintains its position as the most popular device when it comes to listening to digital
radio, accounting for 63.9% of all digital hours, however listening via DTV (digital television) and internet
have both continued to rise year on year (hours up by 8% and 32%  respectively), albeit from a smaller
base.
- DAB hours are 194 million (162m in Q3, 2010 – up 20%)
- DTV hours are 50 million (47m in Q3, 2010 – up 8%)
- Internet hours are 40 million (30m in Q3, 2010 – up 32%)
The  share of radio listening via a digital platform now stands at 28.2%  of all radio listening, increasing
from 24.8% in  Q3, 2010 and up quarter on quarter by 5% (c.f. 26.9% in Q2, 2011).   DAB listening
increased its share from  15.3% in Q3, 2010 to  18% in Q3, 2011, while the share of  DTV listening
increased from 4.4% in Q3, 2010 to reach 4.7% this quarter; and internet listening, which currently stands
at 3.7% for Q3, 2011, is up from 2.8% in Q3, 2010"
Source:  Data from Rajar, reported in a press release, 27th October 2011

40% of Coldplay's first 3 day UK sales for Mylo Xyloto are from downloads

"Coldplay are on course to score their fifth Official Albums Chart Number 1 this weekend, as well as notching up one of the best-selling opening weeks of any album release this year, according to today’s Official Chart Update.
‘Mylo Xyloto’, Coldplay’s fifth studio album, has kicked off the week to a flying start, racking up sales of over 122,000 in its first three days of sale.  The release is now set to become one of the fastest-selling albums of 2011, with a massive 40% of UK sales to date coming from downloads.  All eyes look set on the British rockers breaking the 200,000 sales barrier by Sunday, a feat this year only accomplished by two other Number 1 albums, Adele’s ‘21’ and Lady Gaga’s ‘Born This Way’.
A positive knock-on effect also appears to be taking shape on Coldplay’s back catalogue, with the band enjoying four additional slots in today’s Top 75; ‘Parachutes’ (49), ‘Viva La Vida or Death And All His Friends’ (51), X&Y (55) and ‘A Rush Of Blood To The Head’ (66)."
Source:  Press release from The Official Charts Company, 26th October 2011

Wednesday, October 26, 2011

Tuesday, October 25, 2011

3G penetration by market, Q2 2011


Click to enlarge

Source:  Data from Informa & WCIS+, taken from Mary Meeker's Internet Trends presentation 2011, KPCB, October 2011

Mary Meeker's Internet Trends October 2011

Online display ad spend rose 21% in Europe in 2010

"The headline number for display in Europe is now €5.8 Billion – a 21.1% growth on last year’s figures. It’s difficult to acertain how much traditional display has really grown, as there is no break out numbers for Facebook. I think the IAB will have to do this next year – so we can a real feel for how the different channels are faring in terms of media spend. I have produced a chart of the top performing countries in the market. The UK and Germany are way out ahead, clocking in at just over 1 billion euro each. France comes in at third – closely followed by Italy."
Source:  Data from the IAB Europe, compiled by PwC, reported by ExchangeWire, 29th September 2011
Note - Data is compiled for 25 markets in Europe and relates to full year 2010

Netflix lost over 800,000 subscribers in Q3 2011

"Netflix ended the third quarter of 2011 with just 23.8 million total subscribers — 810,000 fewer subscribers that the previous quarter, the company revealed today in its latest earnings report.
So, where did those lost subscribers go? Most of the losses are attributedto the company raising subscription rates by 60 percent on its DVD-by-mail service. The low numbers are also reflective of Netflix’s unpopular decision to split its DVD-by-mail business into a separate company called Qwikster — a move that Netflix later canceled after receiving backlash from its customer base."

Nearly 80% of US kids' spend on entertainment goes on physical goods

"[A]ccording to a study shared by NPD Group, kids between the ages of 2 and 14 in the US still overwhelmingly purchase physical goods.        
That is, 79 percent of their entertainment purchases by value - across all media types - are of the tangible variety.  "For every dollar kids (ages 2-14) spend on entertainment content, $0.79 goes to physical format content and $0.21 goes towards digital format content," the report authors shared with Digital Music News.
Oddly, the stat seems to fit.  In a presentation earlier this year, NPD Group analyst Russ Crupnick reported that 55 percent of music buyers - across all ages - are still solely purchasing CDs, though the broader number of buyers is shrinking. "

Sky TV makes an average of £535 per customer per year in the UK

"Sky is a machine. The economy may be tough, and Sky may have felt it necessary to freeze prices. But the broadcaster doesn't have to worry when the average take per customer is a hefty £535 a year. Meanwhile, although the household growth rate is slowing (26,000 in the quarter when the new football season started), turnover is up by 9% in the quarter to 30 September and operating profit ahead by 16% at an adjusted £295m.
When it comes to Sky's traditional business of pay-TV, it is clear that somewhere between 40% and 50% of all UK homes will end up taking its service. Its current base of 10.2m TV customers is quite enough to provide a meaningful available audience for all those US imports and sport services. But clearly, growth here is reaching its limits, and Sky is probably unwilling to slash the price it pays for football just to boost profits in the short term.
Then again, Sky doesn't have to. Its growth can come from upgrading people to HD (3.9m done so far), and from its faster-growing internet and telecoms services. In an era of household retrenchment, bundling services to take advantage of discounts is clearly of value. Telecoms customers grew by 26% in the last year to 3.2m; broadband subscribers by 24% to 3.5m. It is through these activities that Sky can rely on for its next phase of growth."

Monday, October 24, 2011

Apple sold 17m iPhones and 11m iPads in the quarter to October 2011

"Apple® today announced financial results for its fiscal 2011 fourth quarter ended September 24, 2011. The Company posted quarterly revenue of $28.27 billion and quarterly net profit of $6.62 billion, or $7.05 per diluted share. These results compare to revenue of $20.34 billion and net quarterly profit of $4.31 billion, or $4.64 per diluted share, in the year-ago quarter. Gross margin was 40.3 percent compared to 36.9 percent in the year-ago quarter. International sales accounted for 63 percent of the quarter’s revenue.
The Company sold 17.07 million iPhones in the quarter, representing 21 percent unit growth over the year-ago quarter. Apple sold 11.12 million iPads during the quarter, a 166 percent unit increase over the year-ago quarter. The Company sold 4.89 million Macs during the quarter, a 26 percent unit increase over the year-ago quarter. Apple sold 6.62 million iPods, a 27 percent unit decline from the year-ago quarter."
Source:  Press release from Apple, 18th October 2011

Apple sold more than 4m iPhone 4S in the first weekend

"Apple® today announced it has sold over four million of its new iPhone® 4S, just three days after its launch on October 14. In addition, more than 25 million customers are already using iOS 5, the world’s most advanced mobile operating system, in the first five days of its release, and more than 20 million customers have signed up for iCloud®, a breakthrough set of free cloud services that automatically and wirelessly store your content in iCloud and push it to all your devices. iPhone 4S is available today in the US, Australia, Canada, France, Germany, Japan and the UK, and will be available in 22 more countries on October 28 and more than 70 countries by the end of the year."
Source:  Press release from Apple, 17th September 2011

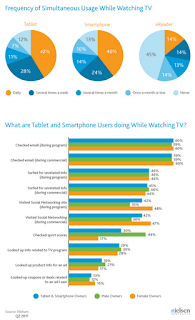
Frequency of using tablets, smartphones & eReaders while watching TV


Click to enlarge

Source:  Research by Nielsen, reported on NielsenWire, 13th October 2011
Note - US only

More tablets were shipped than netbooks in Q2 2011

"Media tablet shipments surpassed netbook shipments this quarter, reaching 13.6 million units, compared to just 7.3 million netbooks. Netbooks had previously led the way with 8.4 million shipments in 1Q11, compared to just 6.4 million media tablets.
“This is a trend that we do not expect will reverse,” says Jeff Orr, group director, mobile devices. “As they are different segments, this is not a direct replacement behavior, but a changing of leadership for the most interesting device type.”
Driving media tablet interest is Apple’s iPad 2. 68% of the media tablet shipments in 2Q11 consisted of Apple iPad models. Consumers are choosing tablets over netbooks for a number of reasons. “Media tablets are perceived to be easy to use, compared to the keyboard and mouse interface of a netbook computer. Those who have avoided PCs because they are difficult to use – think the Baby Boomer generation and older – see media tablets as an opportunity to re-engage with Internet access. Cost, however, is certainly not a reason driving tablet interest, as the average media tablet costs approximately $600 and the average netbook is only about half of that,” says Orr."
Source:  Data from ABI Research, reported in a press release, 20th October 2011

The preferred sources for product & service information


Click to enlarge

Source:  Data from NMIncite (Nielsen & McKinsey), reported in NielsenWire 14th October 2011
Note - I'm assuming that this is based on US consumers only

6% of shopping searches in Brazil come from mobile devices

"Across Latin America, smartphones and mobile broadband subscribers are growing at a high rate and have in turn driven the mobile strategies of wireless operators. Today, Brazil is No. 5 in the world in number of Internet users and is second to China in growth of 3G subscribers year-over-year.
“The mobile Web is exploding in Brazil, helped with the increase of prepaid data, which is cheaper than going to cyber cafes and also more private,” noted Google’s head of mobile advertising for Latam, Peter Fernandez, during the Mobile Marketing Association Forum in São Paulo.
People are changing their lifestyle and how they consume information. Companies, as well as advertising agencies, carriers and applications developers have to understand that and move forward to provide these new customers what they demand.
“Now, 6% of shopping searches in Brazil are coming from mobile. It’s a 700% growth compared to the past year, and eight times faster than desktops,” noted Fernandez."

Over 70m Americans accessed social sites or blogs via mobile in August 2011

"comScore, Inc, a leader in measuring the digital world, today released results of a study on mobile social media usage based on data from its comScore MobiLens service, which showed that 72.2 million Americans accessed social networking sites or blogs on their mobile device in August 2011, an increase of 37 percent in the past year. The study also provided new insights into how mobile users interact with social media, finding that more than half read a post from an organization, brand or event while on their mobile device.
“Social media is one of the most popular and fastest growing mobile activities, reaching nearly one third of all U.S. mobile users,” said Mark Donovan, comScore senior vice president for mobile. “This behavior is even more prevalent among smartphone owners with three in five accessing social media each month, highlighting the importance of apps and the enhanced functionality of smartphones to social media usage on mobile devices.”
In August 2011, more than 72.2 million people accessed social networking sites or blogs on their mobile device, an increase of 37 percent from the previous year. Nearly 40 million U.S. mobile users, more than half of the mobile social media audience, access these sites almost every day, demonstrating the importance of this activity to people’s daily routines.
Research also indicated that although more people accessed these sites via their mobile browser, the social networking app audience grew five times faster in the past year. While the mobile browsing social networking audience grew 24 percent to 42.3 million users in the past year, the mobile social networking app audience surged 126 percent to 38.5 million."
Source:  Press release from comScore, 20th October 2011

340 new smartphone models were released in China in Q1-Q3 2011

"Cao Shumin, director of the Ministry of Industry and Information Technology's (MIIT) China Academy of Telecommunication Research (CATR), said recently that between Q1-Q3 this year, 340 new smartphone models were released on the China market, up 100% YoY. Cao said that smartphones held 10% of the total handset market during the same period, adding that 80% of domestic smartphones sold were Android-based.
Domestic smartphone production grew rapidly between Q1-Q3 2011 to reach 70 mln units, or 22% of all new handsets, nearly double that for the first nine months of 2010. Cao said that China's domestic tablet market is still in its early stages, but that currently there are about 20 models that combined for total production of approximately 1 mln units over the first nine months of 2011."
Source:  Zol.com.cn, via Marbridge Daily, 21st October 2011

Friday, October 14, 2011

50% of the players of The Sims Social are Zynga players

"Electronic Arts came out of nowhere when it launched The Sims Social on Facebook. The social game that simulates human life took off like wildfire, surpassing FarmVille and closing in on Zynga’s most popular game, CityVille. Now Raptr, the social network for gamers, has revealed some interesting data about just who is playing The Sims Social. As suspected, many of the players came from Zynga.
The majority of The Sims Social’s user base are Zynga players, according to data collected from 10 million people on Raptr’s gamer social network. EA’s own social games and The Sims 3 accounted for only 15 percent of the total players of The Sims Social. Zynga players, on the other hand, account for 50 percent of all of The Sims Social players. About 30 percent came from other social games, and 5 percent came from World of WarCraft.
The Sims Social is now the No. 2 game on Facebook with 66 million monthly active players, compared to 76 million for CityVille, according to AppData. If roughly half of those players came from Zynga, we’re talking about close to 33 million users. Of course, not every single one of the Zynga players has quit playing a Zynga game in order to play The Sims Social. But CityVille has dropped from more than 100 million players."
Source:  VentureBeat, 12th October 2011

Telecom company China Mobile has 9.5m customers with iPhones

"In a speech yesterday at the CEO Manpower Conference 2011 hosted by the Hong Kong General Chamber of Commerce, China Mobile (NYSE: CHL; 0941.HK) chairman Wang Jianzhou said that the mobile operator currently adds more than 1 mln new iPhone users each month, and was serving a total of 9.5 mln iPhone users as of the end of September."
Source:  ChinaNews.com via Maarbridge Dailey, 13th October 2011

Google made nearly $10bn in revenue in Q3 2011

"Revenues – Google reported revenues of $9.72 billion in the third quarter of 2011, representing a 33% increase over third quarter 2010 revenues of $7.29 billion. Google reports its revenues, consistent with GAAP, on a gross basis without deducting TAC.
Google Sites Revenues - Google-owned sites generated revenues of $6.74 billion, or 69% of total revenues, in the third quarter of 2011. This represents a 39% increase over third quarter 2010 revenues of $4.83 billion.
Google Network Revenues - Google’s partner sites generated revenues, through AdSense programs, of $2.60 billion, or 27% of total revenues, in the third quarter of 2011. This represents a 18% increase from third quarter 2010 network revenues of $2.20 billion.
International Revenues - Revenues from outside of the United States totaled $5.3 billion, representing 55% of total revenues in the third quarter of 2011, compared to 54% in the second quarter of 2011 and 52% in the third quarter of 2010. Excluding gains related to our foreign exchange risk management program, had foreign exchange rates remained constant from the second quarter of 2011 through the third quarter of 2011, our revenues in the third quarter of 2011 would have been $53 million lower. Excluding gains related to our foreign exchange risk management program, had foreign exchange rates remained constant from the third quarter of 2010 through the third quarter of 2011, our revenues in the third quarter of 2011 would have been $483 million lower.
Revenues from the United Kingdom totaled $1.05 billion, representing 11% of revenues in the third quarter of 2011, compared to 12% in the third quarter of 2010.
In the third quarter of 2011, we recognized a benefit of $1 million to revenues through our foreign exchange risk management program, compared to $89 million in the third quarter of 2010.
A reconciliation of our non-GAAP international revenues excluding the impact of foreign exchange and hedging to GAAP international revenues is included at the end of this release.
Paid Clicks – Aggregate paid clicks, which include clicks related to ads served on Google sites and the sites of our AdSense partners, increased approximately 28% over the third quarter of 2010 and increased approximately 13% over the second quarter of 2011.
Cost-Per-Click – Average cost-per-click, which includes clicks related to ads served on Google sites and the sites of our AdSense partners, increased approximately 5% over the third quarter of 2010 and decreased approximately 5% over the second quarter of 2011."

Thursday, October 13, 2011

TV advertising in the UK delivers an average return of £1.70 per £1.00 invested

"Amid gloomy economic forecasts, a new study has revealed how advertising performed during the economic downturn in recent years. It shows that TV advertising created the most profit (an average return of £1.70 for every £1 invested), and that its return on investment (ROI) has increased by 22% in the last five years.
Payback 3, an independent study commissioned from Ebiquity by Thinkbox, is an econometric analysis of 3,000 ad campaigns across nine advertising sectors between 2006 and 2011. It compares, on a like-for-like basis, the sales and profit impact during the last five years of five forms of advertising: TV, radio, press, online static display and outdoor.
Other key findings include:
TV advertising is 2.5 times more effective at creating sales uplift per equivalent exposure than the next best performing medium (press);
TV advertising has a ‘halo effect’ across a brand’s portfolio. 38% of TV’s sales effect is felt by products not directly advertised;
TV’s ‘halo effect’ also makes other forms of advertising work harder;
TV is responsible for 71% of attributable sales in Ebiquity’s database, but only accounts for 55% of spend.
Effective profit
Ebiquity found that TV advertising’s ROI is on average 22% higher than five years ago, despite the recession. This is because TV’s effectiveness (sales uplift per exposure) has remained undiminished while the cost of advertising on TV has been falling in both absolute and relative (inflation-adjusted) terms.
TV also delivers the most extra profit, Ebiquity found: an average return of £1.70 for every £1 invested (ROI of 1:1.7). This compares to £1.48 for radio, £1.40 for press, £1.06 for online static display, and £0.45 for outdoor advertising."
Source:  Research by Ebiquity for Thinkbox, reported in a press release, 13th October 2011

UK marketing budgets were revised up in Q3 2011, with online seeing the largest rise

"The latest IPA Bellwether survey published today (Thursday 13th October 2011) reveals that marketing budgets were revised up in Q3 ending a three-quarter period of decline, as companies increased expenditure to promote new products and maintain market share amid strong competitive pressure.  With 21% of companies reporting an upward revision compared to 17% that reported a reduction, the resultant net balance* rose to a one-and-a-half-year high of 3.4% (up from -2.2% in Q2).
(net balance calculated by subtracting the percentage reporting a downward revision from the percentage reporting an upward revision.)
For the first time since Q2 2007 budgets for all sectors were revised up. The internet saw the steepest increase by a wide margin and the largest quarter-on-quarter jump in the history of the report, with a net balance of 16.6% (up from 1.9% in Q2). Main media spend, a category which includes the internet, recorded the slowest pace of budget growth and only a marginal rise, suggesting a shift to online. Direct marketing budgets were revised upwards to the greatest degree for a year, while sales promotion and ‘all other’ (below-the-line) recorded growth for the first time in 15 and 16 quarters respectively.
Yet business optimism is falling further, with marketing executives’ confidence for the industries in which they operate hitting a two-and-a half year low: the net balance of -23.3% was down from -10.9% in Q2. Even though marketing executives were slightly more optimistic about their own companies’ prospects the degree of optimism was the second lowest since Q1 2009."
Source:  Data collected & reported by the IPA, 13th October 2011

Average Click Throughs on Facebook Q3 2011

Data from US, UK, France, Germany & Canada


Click to enlarge

Source:  Data TBG Digital campaigns from 5 markets in Q3 2011, collected & published in TBG Digital's Global Facebook Advertising Report, October 2011

Smartphones & tablets accounted for 7% of all US web traffic in August 2011

"Smartphones and tablets — particularly the iPad — are becoming an increasingly significant source of web traffic in the U.S.
According to web analytics firm comScore, smartphones and tablets accounted for 6.8% of all web traffic in the U.S. in August.
Approximately two-thirds of that 6.8% came from mobile phones, while the remaining third came from tablet devices. The iPad dominated the latter category, accounting for 97.2% of tablet traffic.
The iPad is driving more web traffic than the iPhone, accounting for 46.8% of all traffic originating from iOS devices in August, compared to the iPhone’s 42.6% share. iOS’s total share of U.S. mobile web traffic in August was 58.5%."
Source:  Data from ComScore, reported by Mashable, 11th October 2011

Next Generation Media - October 2011

It's that time again - please have a look at my new summary of the best from my monitoring of what's happening in digital media from the past 3 months.


Several of the stories should be familiar to regular readers of this blog, and my 'examples' blog

Wednesday, October 12, 2011

18% of internet users access solely through a mobile connection

"Mobile is increasingly the primary platform for internet access, according to today’s Global Consumer Survey (GCS) report from MEF, the global community for mobile content and commerce.
Based on research conducted among over 8,000 respondents in nine countries across five continents, the MEF GCS found that 72% access the mobile internet on a daily basis with 18% no longer using fixed line internet access whatsoever. In each individual market, the number of consumers accessing the mobile internet daily is higher than the number accessing fixed-line internet."
See an extract here
The markets surveyed were:  Brazil, Egypt, India, Indonesia, Qatar, Singapore, South Africa, UK & US

70% of mobile payment company Square's merchants did not previously accept credit cards

"Square is nixing a policy that prevented merchants from immediately receiving any profits exceeding $1,000 per week, looking to attract even bigger businesses and edge out rivals in the growing mobile payment market.
Square originally implemented this measure to prevent fraud, according to company CEO Keith Rabois. "Now that we've been commercially available for a year, we can now spot statistical anomalies," he explained.
Such an improvement stands to lure larger stores into Square's fold, since they won't have to wait up to one month to recoup their additional profits. At the moment, Square's base is mainly small businesses, 70 percent of which did not previously accept credit cards because of associated fees.
The San Francisco, Calif.-based company now boasts 800,000 merchants and processes $2 billion in payments, according to Rabois.
"In a year, we've been able to offer payment services to the equivalent of 10 percent of Visa and MasterCard's network," the CEO said."

Crowdsourcing site Kickstarter has had more than 1m funders


Click to enlarge


Total Backers: 1,013,725
Repeat Backers: 166,823

Source:  Blog post from Kickstarter, 11th October 2011
(Lots more data in the blog post)

Tuesday, October 11, 2011

Online advertising drives offline sales for CPGs / FMCGs

"comScore, Inc, a leader in measuring the digital world, and dunnhumbyUSA, a global leader in building brand value for consumer goods and retail companies, today released results of multiple studies measuring the offline sales impact of online display advertising for consumer packaged goods (CPG) advertisers. Retail sales were measured by analytically linking the permission-based comScore panel of one million U.S. Internet users to their anonymous loyalty card in-store purchase data provided by dunnhumbyUSA; no identifiable personal data was disclosed. By comparing the in-store brand buying of households exposed to online advertising with that of households not exposed, it was possible to determine the impact of online advertising campaigns. The results of the studies indicate that exposure to online display ads can lead to improved in-store sales for CPG brands.
[...]
An analysis of multiple CPG online ad campaigns that involved comparing the offline buying of households exposed to advertising with the buying behavior of households who were not exposed revealed a median in-store sales lift of 21 percent among the exposed households, with five out of every six campaigns generating a positive sales lift. Approximately 70 percent of campaigns generated a double-digit sales lift, and more than 40 percent generated lifts of at least 30 percent.
comScore also analyzed the offline sales results of a limited set of ad effectiveness campaigns that leveraged a new advertising product called Microsoft CPG Online Effect. This solution uses sophisticated predictive targeting algorithms powered by anonymous in-store buying data from dunnhumbyUSA coupled with online browsing data from comScore. These targeting algorithms are deployed by Microsoft Corp. across its network of sites.
The results showed an in-store sales lift of 42 percent, double the lift from campaigns that were not targeted using this approach. These results demonstrate how targeting algorithms can help improve efficiency and effectiveness in display ad delivery, providing more relevant ads to consumers, improved ROI for advertisers and higher CPMs for publishers. Dr Pepper Snapple Group is one of more than 20 CPG advertisers that have used this purchase-based targeting solution."
Source:  Press release from comScore, 11th October 2011

98% of online Americans aged 18-24s use social media

"Has the term "social Web" become redundant? Nearly so, it seems, as 91% of online adults - or 129 million consumers - now access social media at least once a month.
So says a new study from Experian Simmons, which, even more remarkably, finds that 98% of online 18-to 24 year-olds use social media monthly.
Narrowing the generational divide, Experian Simmons finds that the greatest growth sector for social is among older Americans.
In fact, the share of those in the 65-plus category who use social media grew a relative 50% in the past two years alone. As such, nearly 3-in-4 online seniors now use social media in a typical month, as do 82% of those ages 55 to 64."
Full report here

Asos' mobile sales rose 800% Y-o-Y in 2011

"Leading online fashion retailer Asos.com has launched its first apps for the Apple range of mobile devices, following strong sales growth via mobile devices.
The new service has been designed for iPhone, iPad and iPod Touch users, and along with the function to ‘save for later’ any item of interest sold by the trader, the app also includes a locator for local drop-off points for customers looking to return unwanted purchases.
Customer accounts are totally synchronised across all of the retailer’s platforms so whether they are using the new apps, the standard website or the mobile site all of their details will remain consistent.
James Hart, Asos E-commerce Director, said: Following year-on-year growth of over 800 per cent in mobile revenue, I’m delighted to release our iPad and iPhone shopping apps.
“We decided to take a considered approach to releasing these first apps, so that their foundations were rock-solid, thereby allowing us to now develop and improve the experiences at pace.”"

Spotify made a loss of £26.5m in 2010

"Accounts filed with Companies House show the likely reason Spotify wanted to break America so badly.
Last year, the music service’s revenue exploded by 458 percent, but its income was more than swallowed up by growing outgoings. So Spotify finished 2010 with a deeper annual loss of £26.5 ($41.46) million.
“It is crucial that Spotify continues to penetrate existing and new markets as quickly as possible,” according to Spotify’s accounts filed at Companies House.
2010 was, however, the year when subscriptions (£45 ($70.4) million) began leaping ahead of advertising income (£18 ($28.16) million) for Spotify…
These accounts, of course, are almost a year old. In 2011, Spotify tightened available free music and got the U.S. launch it wanted. Now its path to success looks far more likely. It now has over two million paying subscribers - more than any rival service."

Monday, October 10, 2011

Apple achieved over 1m pre-orders of the iPhone 4S on the first day

"Apple® today announced pre-orders of its iPhone® 4S have topped one million in a single day, surpassing the previous single day pre-order record of 600,000 held by iPhone 4. iPhone 4S is the most amazing iPhone yet, packed with incredible new features including Apple’s dual-core A5 chip for blazing fast performance and stunning graphics; an all new camera with advanced optics; full 1080p HD resolution video recording; and Siri™, an intelligent assistant that helps you get things done just by asking."
Source:  Press release from Apple, 10th October 2011

The first email was sent in October 1971

"It’s become a firm fixture of everyday life, loathed by some but essential to nearly all of us, and yet its future is far from certain. Email is forty years old this month, with the first message having been sent in October 1971."

Online coupons drive incremental business

"Online coupons and promotion codes drive incremental business: Offering coupons and deals generates new users and increases overall user spending. Active coupon users reported spending over $800 more per year with e-commerce merchants than less active coupon users ($1,850 versus $1,025). In addition, 74% of active coupon users indicated that they would be likely to try a new brand if they received a coupon or promotion code versus 54% of less active coupon users.
Online coupons and promotion codes positively influence the purchase cycle by reducing shopping cart abandonment, improving conversion rates and reinforcing positive feelings about brands. Additionally, 88% of respondents said that promo codes or coupons “close the deal” on their decision to make a purchase.
Reduced shopping cart abandonment: 60% of respondents indicated that if they received an online coupon or promotion code they would be more likely to reconsider purchasing a product that they had put in their shopping cart but had not bought.
Improved brand loyalty and reputation: 80% of respondents indicated that offering online coupons or promotion codes improves a company’s brand image, with an impressive 88% of respondents saying that they have positive feelings toward companies that offer coupons."
Source:  Research by Forrester Consulting for Whaleshark Media, reported in a press release, 5th October 2011

Advertising is more effective if seen on multiple platforms

"In the group that was exposed to TV ads alone, 50 percent of people correctly attributed the ad to the correct auto brand. For groups that saw the ad across all screens – TV, computer, smartphone and tablet – the ability to remember the brand jumped dramatically to nearly three-in-four (74%).
Similarly, only 22 percent of the group exposed to just the TV ad was able to correctly remember that the ad was for a 4-door sedan versus 39 percent of the group that saw the ad across all screens."
Source:  Research from Nielsen, commissioned by Google, reported on Nielsen's blog, 29th September 2011

Online buzz can drive ratings for TV shows

"An analysis conducted by NM Incite, a Nielsen/McKinsey Company, and Nielsen looked at the correlation between online buzz and television ratings and found a statistically significant relationship throughout a TV show’s season among all age groups, with the strongest correlation among younger demos (people ages 12-17 and 18-34), and a slightly stronger overall correlation for women compared to men.  Men over 50 showed the weakest buzz-to-ratings connection leading up to a show’s premiere through the middle of the season, but that relationship strengthened by the finale as all age groups were actively discussing a TV show via social media.
Among people aged 18-34, the most active social networkers, social media buzz is most closely aligned with TV ratings for the premiere of a show.  A few weeks prior to a show’s premiere, a nine percent increase in buzz volume correlates to a one percent increase in ratings among this group.  As the middle of the season approaches and then the finale, the correlation is slightly weaker, but still significant, with a 14 percent increase in buzz corresponding to a one percent increase in ratings."
Source:  Research by NM Incite, a Nielsen/McKinsey Company, and Nielsen, reported in Nielsen's blog, 6th October 2011

Smartphone penetration in APAC by market

I created this chart with Google's new online mobile data too.  Data comes from Google and Ipsos.


Click to Enlarge

There are lots of other markets & measures.  Create your ownhere.
Source:  Google, Ipsos & MMA 2011.  Full info here

Smartphone penetration in Europe by market

I created this chart with Google's new online mobile data too.  Data comes from Google and Ipsos.


Click to Enlarge

There are lots of other markets & measures.  Create your own here.
Source:  Google, Ipsos & MMA 2011.  Full info here

Friday, October 7, 2011

Coca Cola spends more than 20% of its media budget on social media

"It’s not just that you can’t control it—when you try, it backfires. You have to understand consumers: They would like to be heard. It’s a question of cocreating content. Five years ago social media was 3% of our total media spend. Today it’s more than 20% and growing fast."
Source:  Coca Cola CEO Muhtar Kent, reported by Harvard Business Review, October 2011

The BBC news sites send over 6 million click-throughs to other sites per month

"Last year we were tasked with doubling the number of click-throughs to external sites from the BBC News website by 2013, as part of the BBC's Strategy Review.
This was something I discussed at a panel session I was taking part in at yesterday's News:Rewired conference, organised by Journalism.co.uk, and I wanted to write briefly here about our ongoing efforts to improve the ways in which we link externally from our news articles.
Having asked for the figures from our research team for my presentation, it was great to hear that we appear to be well on track to achieve the goal set for us.
Looking back at the third quarter of 2010, we had an average of around 2.9m external click-throughs per month from UK users. That period - last year's July, August & September - was around the time of the redesign of the News website. That meant, among other changes, that the 'From other news sites' and 'Related internet links' sections moved from the right-hand side to the bottom of news stories. And we have also been doing more linking to external sources from within the text of story pages.
The figures for the third quarter of this year show that all this has had an effect, and it looks as though we've been getting something right. The monthly average is now around 6.1m click-throughs i.e. more than double what it was last year. One caveat is that there have been some big news stories over this period, including the August riots, Norway shootings and Amy Winehouse's death. Another caveat is that we are using a different method to measure the figures now, so whilst the comparison should be pretty accurate, there's a small margin for error."

There is almost no correlation between click through rates of ads and offline sales


(Sales lift on the Y axis, CTR on the X axis.  The random scatter shows that there is little correlation)

Click to enlarge

Source:  Data from Nielsen, quoted on their blog, 3rd October 2011

Samsung is the most popular handset manufacturer in the US


Click to enlarge

Source:  Press release from comScore, 5th October 2011
Note - click on the link to see stats on OS share & more

Tablet users in the US spend more time online than other internet users

"If early adopter metrics are a fair indication, then the tablet is poised to be a genuine game changer in both the ways in which people access the Web and the sheer volume of their use.
According to research from Knowledge Networks, tablet-owning consumers on average spend 48% more time each day with the Internet -- 4 hours and 19 minutes across platforms compared to 2 hours and 55 minutes for all users.
Knowledge Networks extracted the data from their MultiMedia Mentor database of metrics charting media usage across eight media for adults ages 18 to 64.
Owners of tablets spend just under an hour a day (55 minutes) with the Internet on these devices. The other major tablet uses -- social networking, search and gaming -- each account for about 15% or 8 minutes each of tablet time."

Thursday, October 6, 2011

Microfinance company Kiva has loaned nearly $250m in 5 years

"Since Kiva was founded in 2005:
629,358 Kiva lenders
$248 million in loans
98.87% Repayment rate
We work with:
142 Field Partners
450 volunteers around the world
60 different countries"
Source:  Kiva, retrieved 6th October 2011
More stats here

Twitter has 1,600 advertisers

"Twitter’s Chief Revenue Officer Adam Bain took the stage at IAB’s Mixx Conference today and revealed a few milestones for the communications platform, specifically in the advertising area. Bain said that Twitter now has 1,600 advertisers using the platform to reach consumers, and currently has an 80 percent retention rate with advertisers. Back in July Twitter CEO Dick Costolo said that the number of advertisers on Twitter had gone up by 600 percent, since last year when it was in the hundreds.
Back in March, Twitter partnered with Paramount Pictures to launch the trailer for new film SUPER 8 on Twitter. Bain also said today that Twitter helped Super 8 sell 1 million sneak peek tickets, and opening weekend box office exceeded projections by more than 50 percent."

Mobile accounts for 10% of ecommerce website visits

"Mobile now makes up ten per cent of ecommerce website visits, but converts at just half the rate of PC visitors, according to research by Screen Pages.
The study indicated that 80 per cent of all mobile web browsing occurs on Apple devices; namely iPhones and iPads.
It also suggested that smaller marketers and retailers are losing hundreds of thousands of pounds by failing to grasp the opportunities presented by mobile devices.
Based on Google Analytics date, the paper looked at over 1.5 million visitors to 30 websites, none of which had been fully optimised for mobile usage.
"The commercial message here is clear," said Roger Willcocks, director of Screen Pages."
Source:  Research by Screen Pages, reported by the IAB UK, 5th October 2011

Online ad spend in the UK grew by 13.5% Y-o-Y in H1 2011

"A surge in FMCG advertising and a triple-digit increase in online video helped fuel a 13.5% like for like growth in UK internet advertising expenditure, and a half-year 2011 high of £2.26 billion.
The wider UK advertising sector experienced year on year growth of just 1.4% to £8.27 billion between January and June 2011. Internet spend has surpassed forecasts to reach a new market share of 27%, with a quarter of a billion pounds more spent on internet advertising in the first half of 2011 compared to the same period in 2010.
The figures, which exclude mobile advertising expenditure, are collated bi-annually by the Internet Advertising Bureau (IAB), the trade body for digital advertising, in conjunction with PwC and WARC.
Display accounts for nearly a quarter of spend as search and classified still grow
Boosted by sophisticated new formats and 100% growth of online video, display advertising grew by 18.5% year on year on a like for like basis to £510 million, representing a 23% share of online spend in the first half of 2011 (£440 million and 22% share in H1 2010). A combination of direct response and an increased number of social media and brand campaigns delivered this growth.
Although banners and embedded formats still dominate online display (£374 million or 73% share), video doubled in size year on year to £45 million, giving it a 9% share of online display (5% in first half of 2010). This is due to a significant increase in advertisers using video to deliver brand messages.
Paid-for search marketing continued to thrive as advertisers recognise its transparent and measurable benefits during these budget-pressured times. Year on year, search increased 12.6% on a like for like basis to £1,313 million, representing a share of 58% of online advertising (£1,164 million and 58% share in 2010).
Online classifieds grew 3% like for like to £385 million with a share of 17% of online advertising year on year (£379 million and a 19% share in the first half of 2010).
Lead generation, an increasingly important form of performance-based marketing where advertisers pay per sales lead rather than a click through or by an advertisement served, grew by 20% to £26 million (£22 million in H1 2010).
While finance took over from the entertainment sector as the top category spender in display for the first half of 2011, the biggest winner was FMCG, which has grown by six percentage points in two and a half years. Improved measurement tools fuelled this growth, as FMCG marketers learnt that online delivers brand messages and works well as part of a cross-media campaign.
The top display five categories between January and June 2011 were: finance (16%), FMCG (15%), entertainment & media (12%), travel & transport (10%), retail (10%)."
Source:  Press release from the IAB UK, 5th October 2011

Tuesday, October 4, 2011

Every day there are more than a billion searches on Google

"Google has already gone live with a dedicated promotion website to tout enhanced search ads, and published a series of videos that should help advertisers understand what they’re all about.
They also talk numbers, such as:
- Every day there are more than a billion searches on Google. (source: Google)
- Since 2003, Google has answered 450 billion new unique queries. (source: Google)
- The +1 button is being served 2.3 billion times a day all over the web. (source: Google)
- The average query response time is roughly a quarter of a second. (source: Google)
- More than 20% of searches on Google on a desktop are related to location. On mobile, it‘s about 40%. (source: Google)
- People drive more than 12 billion miles a year with Google Maps Navigation. (source: Google)
And:
- Every query has to travel on average 1,500 miles to get back to the user. (source: Google)
- More than half our searches come from outside the U.S. (source: Google)
- We’ve never seen 16% of the queries we see every day. (source: Google)"
Source:  Data from Google's 'Answers' site, republished by TechCrunch, 3rd October 2011

Digital downloads account for nearly 30% of UK album sales

"British music fans are increasingly opting to buy their albums as digital downloads, but overall sales declined in the third quarter.
The music industry continued to suffer from the decline in sales of physical formats such as CDs, according to figures from the Official Charts Company for the three months to September, and the total market was down 11.4% year on year to 21.8m units sold.
Digital downloads accounted for 28.2% of all UK albums sold in the third quarter, up 24.2% on the previous year, to reach 6.1m.
Sales of physical albums, including CD and vinyl, were down 20.5% year on year to 15.5m units."
Source:  Data from the BPI, reported in The Guardian, 3rd October 2011

Monday, October 3, 2011

A third of online home-traders in the UK take home over £10,000 per year

"The online parcel and delivery service Collect+ has discovered that the number of those earning money from online businesses has doubled in the last year.
The survey revealed that over a third of ‘e-pportunists’ take home over £10,000 per year,1 with over half of these traders having set up their businesses within the last year. Over 26 percent of e-pportunists are aged between 25 and 34 years of age, reflecting the current decline of the job market in certain sectors of industry and lower wages.
The findings suggest that many individuals are supplementing their existing incomes with online trading as a way of dealing with the increasing cost of living and difficult economic conditions. Almost a quarter of those surveyed revealed that the pressure of household bills had eased as a result of the income gained through online trading. As much as a third of surveyed consumers plan to abandon their day jobs and concentrate on e-businesses should the ventures become enough of a success – a sentiment shared by over 70% of the additional survey participants."
Source:  Press Release from Collect+, 2nd October 2011
Methodology:  A survey of 368 ‘e-pportunists’ through Startups.co.uk, on behalf of Collect+

Goldman Sachs estimate that Microsoft make $3 - $6 in royalties from each Android device sold

"Google's Android could be making arch-rival Microsoft a cool $444 million (£285 million) in patent levies, a Goldman Sachs analyst has estimated, and not much short of what it makes from its own Windows Phone OS.
The company reportedly calculated the sum by totting up the $3-$6 per handset fee it should be making having reached patent deals with a number of handset makers, including HTC and, more recently, Samsung.
It's a small sum when set against the company's estimated $75 billion in annual revenues, but it not bad pocket money considering the underwhelming sums being made by its own mobile OS, Windows phone. According to Business Insider, this will add up to $0.04 to Microsoft's earnings per share."

Music piracy has fallen in Sweden as a result of streaming services like Spotify

"Copyright and download blog TorrentFreak says that the latest quarterly report from Media Vision (in Swedish) prepared for the industry association Musiksverige (Music Sweden) shows a 25% fall in piracy in the country since 2009.
Streaming services such as Spotify are now the most popular way to consume music. More than 40 percent of the participants in the survey now use a music streaming service, compared to less than 10 percent who say they download music legally. About 23 percent continue to pirate music, but this number is dwindling.
The report also examines why listeners say they are moving away from pirate downloads:
Looking at the motivations for people to switch to legal services, participants in the survey cited “the range of music that’s released” as the primary reason (40%). Other explanations were the absolute increase in available music (30%), and the fact that legal services have become cheaper (24%) and simpler (24%)."
Source:  Wall Street Journal blog, 30th September 2011